How to Create a Safety Staff Performance Score
Overview
VisibleHand has created a Safety Staff Performance Scoring system, which relies on digital documentation as well as sensors that automatically verify staff-patient proximity. You don’t have to use our setup to take advantage of this evaluation system, though. It can work at any facility that uses digital-based Q15 documentation. If you are using paper Q15 documentation and want to work on a Safety Staff Performance Scoring system of your own, please email us at info@visiblehand.com and we will be glad to help.
We created the scoring system detailed in this paper after analyzing hundreds of thousands of patient safety observations (Q15, Q60, 1-on1, etc.) and finding that most facilities have staff who vary widely on how well they perform safety checks. **Some staff are nearly perfect while others seem content to try and ‘fly under the radar’. **To refine and field test a system that could reliably measure staff performance, we partnered with Baptist Hospitals of Southeast Texas. The Assistant Administrator of this hospital, Garrett Craver, has been driving quality improvement and wanted a system he could use to reward his top performers and to employ when coaching staff on how they can improve.
The requirements of the system included:
- Measuring the performance of each staff member with a single individual performance score;
- Providing actionable information Garrett can use to coach underperforming staff;
- Being valid enough to use for HR purposes, such as rewarding consistent top performers; and
- Can be summed across staff members in order to track the performance of each hospital unit, as well as the facility as a whole.
Technique
You can replicate our solution that meets all of these requirements by following these steps:
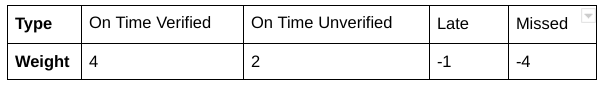
Step 1: Classify each type of safety observation, based on the documentation system you use. VisibleHand is able to ‘verify’ observations, so we use four classifications: [On Time Verified], [On Time Unverified], [Late], and [Missed]. If you use a digital system that does not do proximity verification, you will likely have just three categories; [On Time], [Late], and [Missed]. If you use a paper-based system, you may have just two categories; [Completed] and [Missed].
**Step 2: ** Create a system that ‘weights’ each type of observation. This may take some thought. How would you weight a missed observation compared to one that is documented late? How much ‘better’ is a verified observation than an unverified one? For example, you might select the following weights if you consider a verified observation to be twice as good as an unverified one and a missed observation to be four times as bad as a late one.
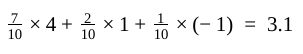
**Step 3: ** For every shift, find the proportion of observations for each staff member that falls into each category and multiply by the corresponding weights. For example, staff member Mark did 10 safety checks. He had 7 On Time Verified observations, 2 On Time Unverified, 1 Late, and 0 Missed, his score would be:
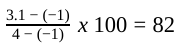
Step 4: Optional but recommended - put the scores from Step 3 on a scale so that they look more like the point system everyone is used to from school (out of 100). There are various ways to do this (see link for some common examples) but a method I’ve found to be useful is to take each staff member’s score, subtract the Late multiplier, and then divide by the difference between the On Time Verified multiplier and the Late multiplier.
For Mark, this would result in a score of
Results
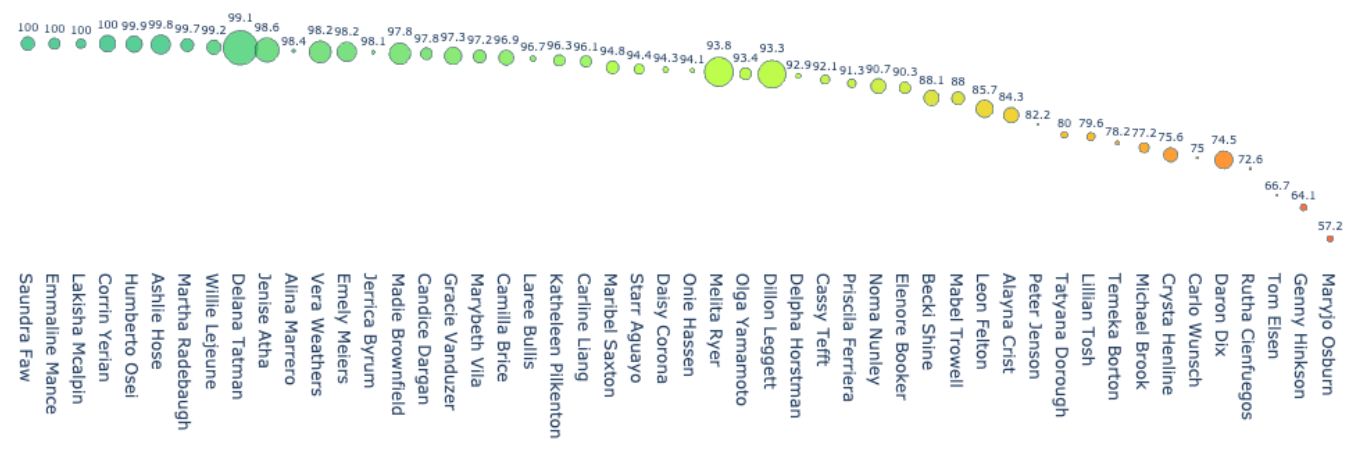
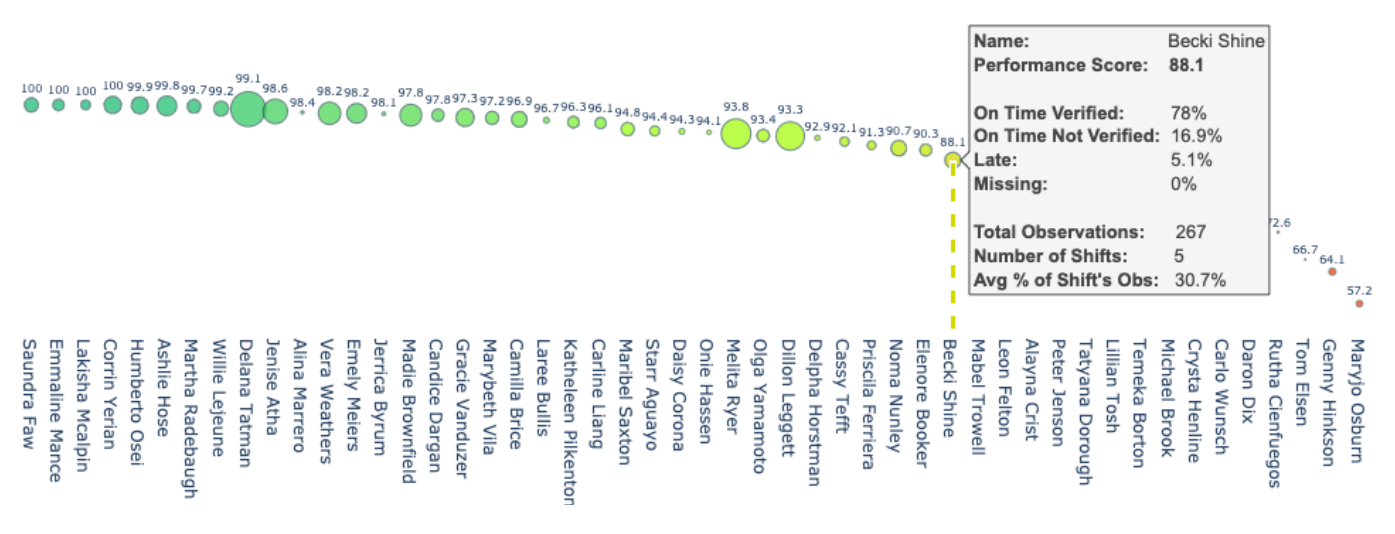
The above technique gives every staff member a score such as the ones you see in the graph below (staff names changed).

Note that this chart employs some visual techniques that allow one to understand various aspects of the data quickly (color and size, in addition to score). It also provides additional details when you select any datapoint.
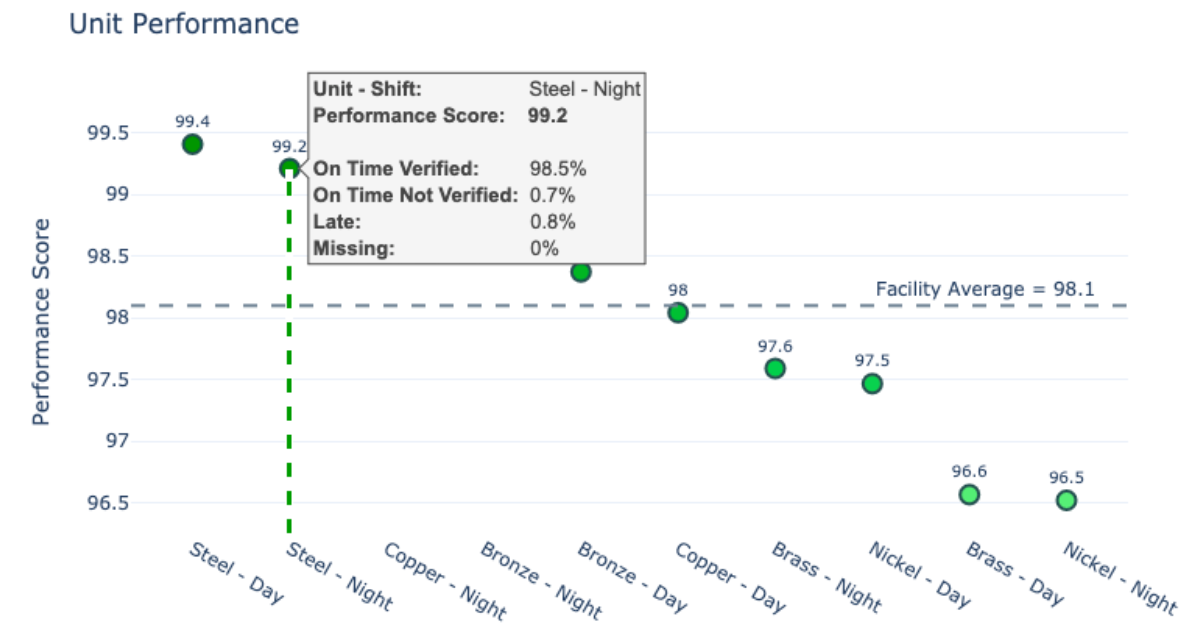
If you would like to use this scoring system to compare units and shifts, apply the formula in Step 3 to all observations within a unit/shift. You can then apply Step 4 to your results and have unit-level scores such as those displayed in the following chart.
Frontline staff have been very receptive to this system. Overall safety quality has improved and motivation to be as perfect as possible has spread throughout.
I hope you have found the concept and method of creating Safety Staff Performance Scores to be intriguing and useful. If you have any comments or questions about the material in this post, or just would like some help thinking about how to help your staff improve, please send me an email at matt@visiblehand.com.